
One-Click SOQL Query Analyzer for Salesforce
Overview
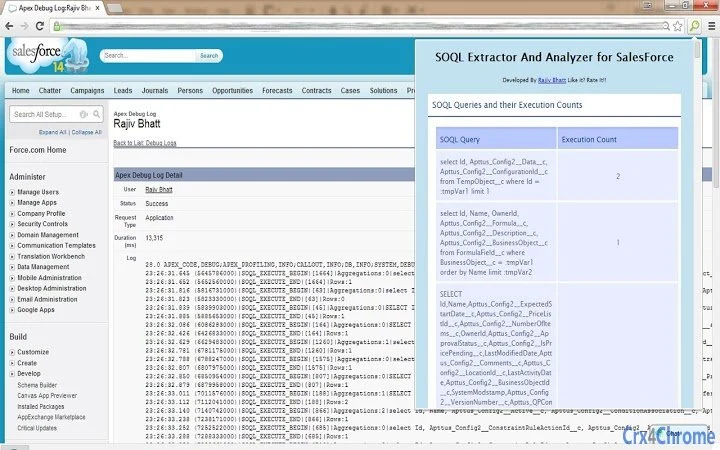
The SOQL Query Analyzer for Salesforce is a browser extension designed to streamline the debugging and optimization of Salesforce applications. It enables developers to extract and analyze SOQL queries directly from debug logs with minimal effort. By processing logs in real time, the tool identifies all SOQL statements, tracks their execution counts, and maps them to the relevant objects—both standard and custom. This functionality helps developers pinpoint inefficiencies such as repeated queries against the same object, which commonly trigger the "Too Many SOQLs" error. The extension is specifically tailored for developers working in the Salesforce ecosystem who need to improve code performance and ensure compliance with governor limits.
It operates exclusively in Classic mode of Salesforce, as specified in the latest update. The tool is particularly useful during development and testing phases, where identifying query patterns and optimizing database calls is critical. Its one-click functionality reduces the manual effort traditionally required to parse lengthy debug logs. The developer has focused on practical utility, incorporating feedback from users to refine the extension’s behavior and compatibility. The extension supports multiple platforms, including Windows, Mac, and Linux, making it accessible to a broad range of developers across different environments.
Key Features & Capabilities
- One-Click SOQL Extraction: Instantly retrieves all SOQL queries from an active debug log without requiring manual parsing.
- Execution Count Tracking: Displays how many times each SOQL query has been executed, helping identify redundant or repetitive queries.
- Object Mapping: Identifies and lists all objects (standard and custom) targeted by the queries, enabling developers to assess data access patterns.
- Nested Method Call Visualization (Beta): Allows users to expand and collapse nested method calls to trace query origins, displaying only user debug and SOQL statements between method entries and exits.
- Log Filtering: Enables filtering of log content by type. When activated, checkboxes appear to select specific log categories, showing only relevant statements.
- Memory Optimization: The extension icon appears only after a debug log is opened, following Chrome’s best practices for performance and resource usage.
These features are especially valuable during code reviews and performance tuning. For instance, if a developer notices that the Account object is queried five times in a single transaction, the tool highlights this pattern, prompting a refactor to consolidate queries into a single, efficient SOQL statement. The beta feature for nested method calls supports deeper troubleshooting of complex logic flows. The filtering capability allows developers to focus on specific aspects of the log, such as SOQL or debug statements, improving workflow efficiency. The tool is designed to integrate seamlessly into existing Salesforce development workflows.
User Interface, Workflow & Performance
The extension presents a clean, minimal interface that appears upon opening a debug log in Salesforce Classic. Navigation is straightforward: users simply activate the extension after loading the log, and the analysis results are displayed immediately. The UI is structured to prioritize readability, with clear labels for queries, execution counts, and associated objects. The addition of expandable sections for nested method calls enhances the depth of analysis without cluttering the main view.
Workflow efficiency is significantly improved by the one-click execution model. Developers no longer need to manually scan through verbose logs or write custom scripts to extract SOQL statements. The tool handles parsing and categorization automatically.
Performance observations are based on general software behavior patterns. The developer did not specify resource usage details. Stability appears consistent with the extension’s lightweight design and adherence to Chrome’s optimization guidelines.
The extension’s icon visibility is conditional—only appearing after a debug log is opened—suggesting efficient memory handling. No performance bottlenecks were reported in the release notes.
Compatibility & System Requirements
The extension is compatible with Windows, Mac, and Linux operating systems, ensuring broad accessibility for developers across different environments. It functions exclusively within the Salesforce Classic interface, as confirmed in the latest version update. The installation size is 2.1 MB, indicating a lightweight footprint. The extension is distributed via the Chrome Web Store and requires a Chrome-based browser to operate.
Exact system requirements were not listed. Compatibility information was partially provided. The extension relies on the Chrome browser’s extension framework and does not require additional runtime dependencies.
The developer did not provide details on CPU or RAM consumption. The extension is designed to work with Salesforce’s debug log format, which may vary slightly across environments. Users should ensure their Salesforce instance is configured to generate debug logs in the expected format for optimal results.
Pros and Cons
Pros
- One-click extraction of SOQL queries from debug logs
- Clear visualization of query execution frequency and target objects
- Supports filtering and nested method call inspection (beta)
- Lightweight design with memory-efficient icon display
- Free to use with no hidden costs
- Available on Windows, Mac, and Linux
Cons
- Only compatible with Salesforce Classic mode
- Some advanced features are in beta and may lack stability
- No official support for Lightning Experience
- Performance details not publicly disclosed
- Dependent on Chrome browser and Web Store availability
FAQ Section
Is this extension compatible with Salesforce Lightning?
The extension currently only works with Salesforce Classic mode. There is no official support for Lightning Experience as of version 2.0.0.0.
Is the extension safe to use?
Yes, the extension operates within the Chrome browser’s security model. It accesses only the debug logs from the current Salesforce session and does not transmit data externally.
How often are updates released?
Updates are released based on user feedback and compatibility needs. Recent versions have focused on fixing manifest issues and improving functionality.
What type of license does it use?
The extension is free to use and distributed under a permissive model. No formal license was specified in the provided information.
Can I use this tool offline?
Yes, once installed, the extension functions without an internet connection, provided the debug log is available locally in the browser.
Final Thoughts
The SOQL Query Analyzer for Salesforce delivers a focused, efficient solution for developers seeking to optimize their Salesforce applications. Its one-click extraction and clear visualization of query patterns significantly reduce the time spent on log analysis. The inclusion of execution counts and object mapping helps developers proactively address performance issues before they impact production environments.
While its restriction to Salesforce Classic mode limits broader usability, it remains a powerful tool for teams still operating in that environment. The beta features, such as nested method call inspection and log filtering, demonstrate a commitment to continuous improvement. For Salesforce developers working in Classic mode, this extension is a valuable addition to their toolkit.
Download SOQL Query Analyzer for Salesforce now.